Analytics · SQL · Python · Tableau

The Data
Index

Sell-through told me what had happened. It never told me what belonged.
Scroll ↓
Before a single answer
  1. 226,904raw orders,
    as exported
  2. 40,985completed ones
    after cleaning
  3. 9,992products,
    deduplicated
  4. 27categories
    they fall into

Case D—01. The reduction is the work — the answer only comes after it.

Cases
Five
Worked through
D—01, end to end
Stack
SQL · Python · Tableau
Data
226,904 raw orders
Finding
€1.53 M given away
€1,53 M
The finding

Given away in discount — because 92.8 % of orderlines were discounted at all.

226,904 raw orders · SQL · Python · Tableau
One case worked through end to end

Five cases where a number was supposed to settle an argument. One is worked through end to end — from raw export to four pricing rules, each argued from the data.

Case D—01 · Eniac · Spanish e-commerce · 2017–18 data

Are discounts actually good for business?

Marketing said discounts drive growth. The board saw orders rising while revenue fell. We rebuilt the true discount signal from 226,904 raw orders — cleaned to 40,985 completed ones — and classified 9,992 products into 27 categories.

The finding: discounting was not a strategy, it was the permanent default. Depth sat at ~20 % all year and barely moved for Black Friday — 23 %, while the Spanish market went to 47 %. Eniac still had its best week of the year on less than half the market's discount. The deepest cuts sat on the cheapest products, which earn the least.

The decision: stop blanket discounting, concentrate it on four events — Black Friday, Christmas, New Year, Valentine's — and cap it by price tier: low ≤ 10 %, medium ≤ 15 %, high ≤ 10 %, premium ≤ 5 %.

Team project · Aylin Yildiz, Khadija, Elena, Rene · WBS Data Analytics Notebooks & 16-slide deck ↗
What it cost
92.8 % of all orderlines discounted
€1.53 M revenue given away — 16.3 % of potential
−0.30 correlation: deeper discount ≠ more revenue
PythonpandasNumPyMatplotlibSeaborn
From the deck  ·  D—01 Repo ↗
226,904 raw orders across four tables, cleaned to 40,985 completed orders
226,904 raw orders, cleaned to 40,985 completed ones
Bar chart: the ten most discounted product categories, mean discount depth 21.4 per cent
The deepest cuts sat on the cheapest categories · mean depth 21.4 %
Monthly revenue bars with average discount depth as a line; the deepest month is not the strongest
Monthly revenue against discount depth — no positive correlation
Recommendation slide: stop blanket discounting, concentrate on four events, introduce price-tier caps, fix the data foundation
The decision, in four rules
From the audit  ·  D—02 Team project · Satish Shrestha, Fabliha Tajneen Chowdhury, Olaf Sierek, Aylin Yildiz Repo ↗
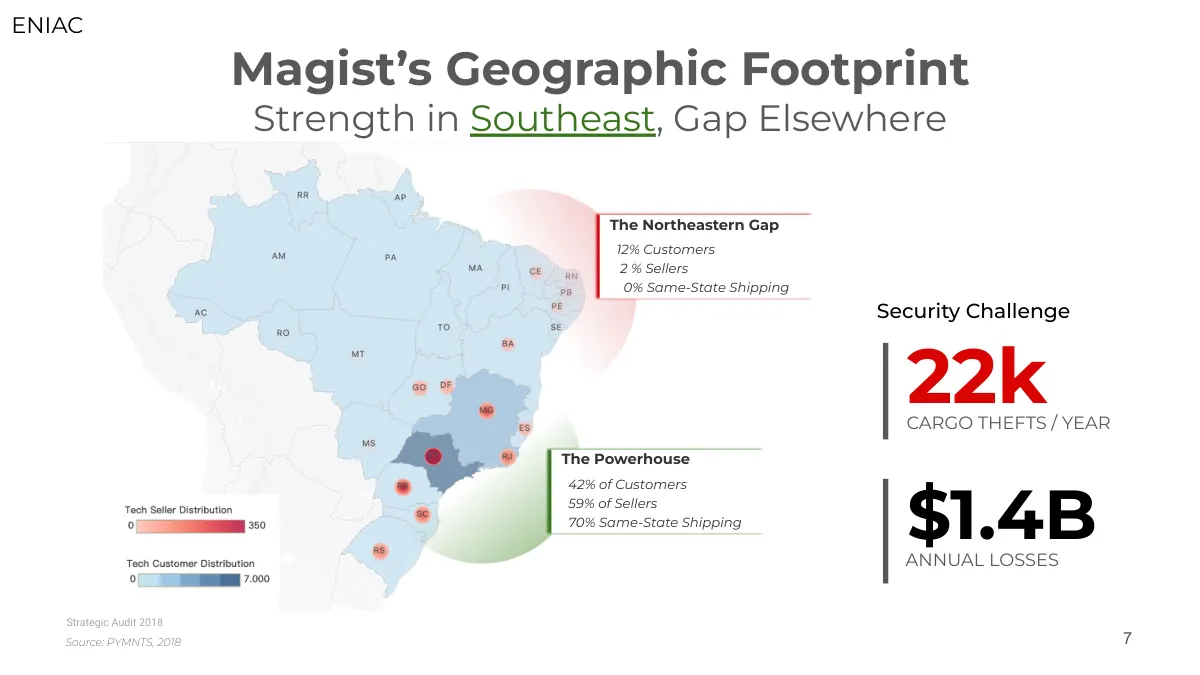
Magist’s geographic footprint: tech sellers and customers by Brazilian state, with the north-eastern gap and the south-eastern powerhouse marked
Magist’s footprint · 42 % of customers sit in the south-east, 12 % in the north-east — and 22,000 cargo thefts a year cost the market $1.4 bn.
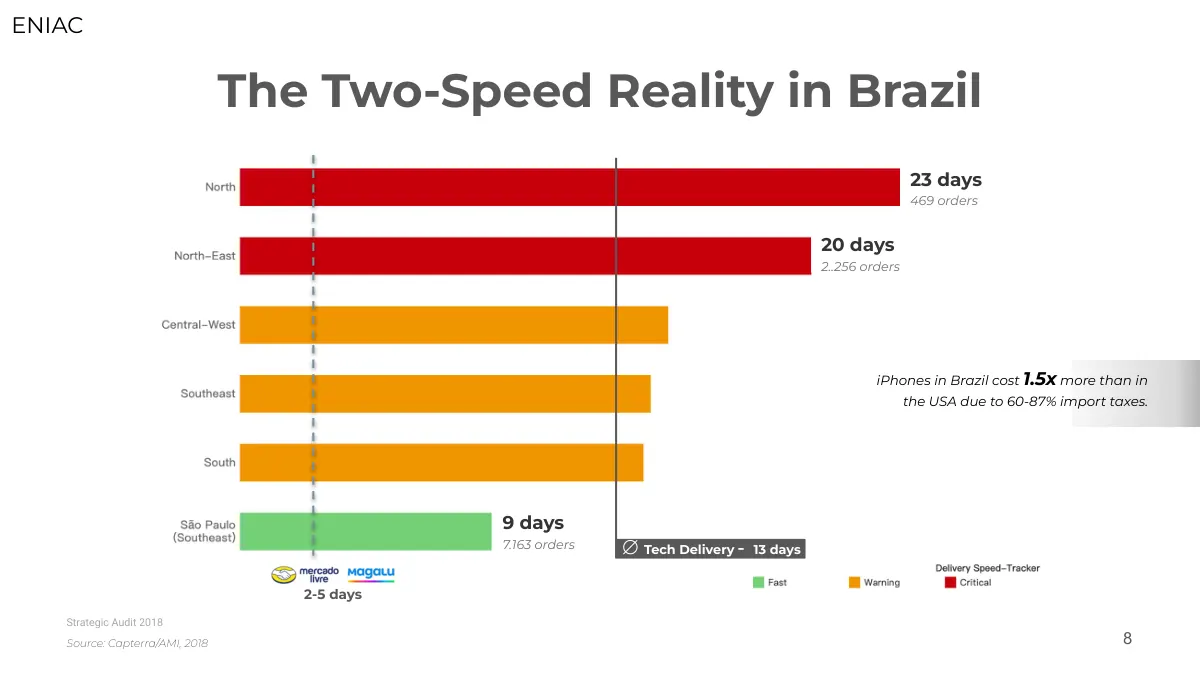
Bar chart of delivery days by Brazilian region: 9 days in São Paulo against 23 in the north
The two-speed reality · 9 days in São Paulo against 23 in the north. The reported 93 % on-time rate rested on 25–30-day estimates.
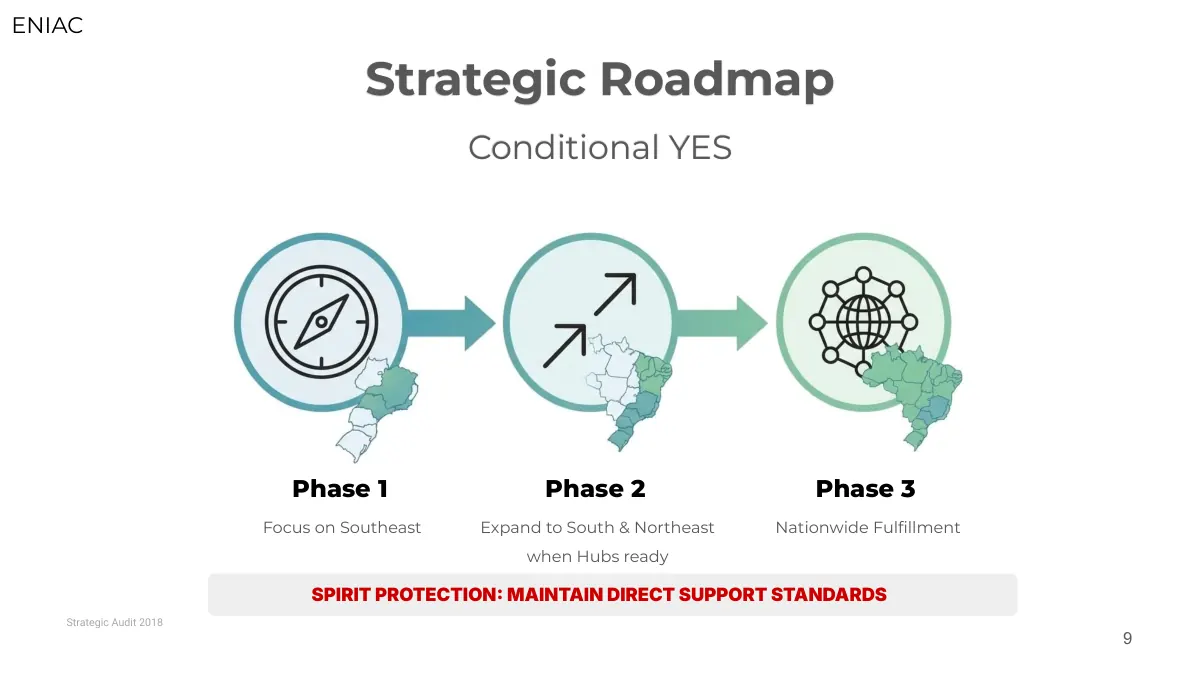
Three-phase roadmap: focus on the south-east, expand to south and north-east, then nationwide fulfilment
The verdict · a conditional yes, in three phases: south-east first, then south and north-east once the hubs hold, then nationwide.
Data pipeline · Azure Medallion architecture
Bronze Raw ingest · Parquet
Silver Cleaned · conformed
Gold Curated · analytics-ready
Counted, then decided.
me@aylin-yildiz.com

Aylin Yildiz — Buying × Data Analytics · Premium & Luxury. Open from September 2026 · Hamburg.

© 2026 Aylin Yildiz · All rights reserved

Contact

me@aylin-yildiz.com

Aylin Yildiz — Buying × Data Analytics · Premium & Luxury
Open from September 2026 · Hamburg